Health Sigma helps regional payer improve provider data quality

Health Sigma helps regional payer improve provider data quality

Most payers struggle to manage and maintain provider data. On an average, 1 in 3 providers have a change in their information every year. Payers receive provider information from multiple sources – tracking and making appropriate updates to the provider master has always been a challenge. Industry spends over $2B every year on provider data and yet problems persist.

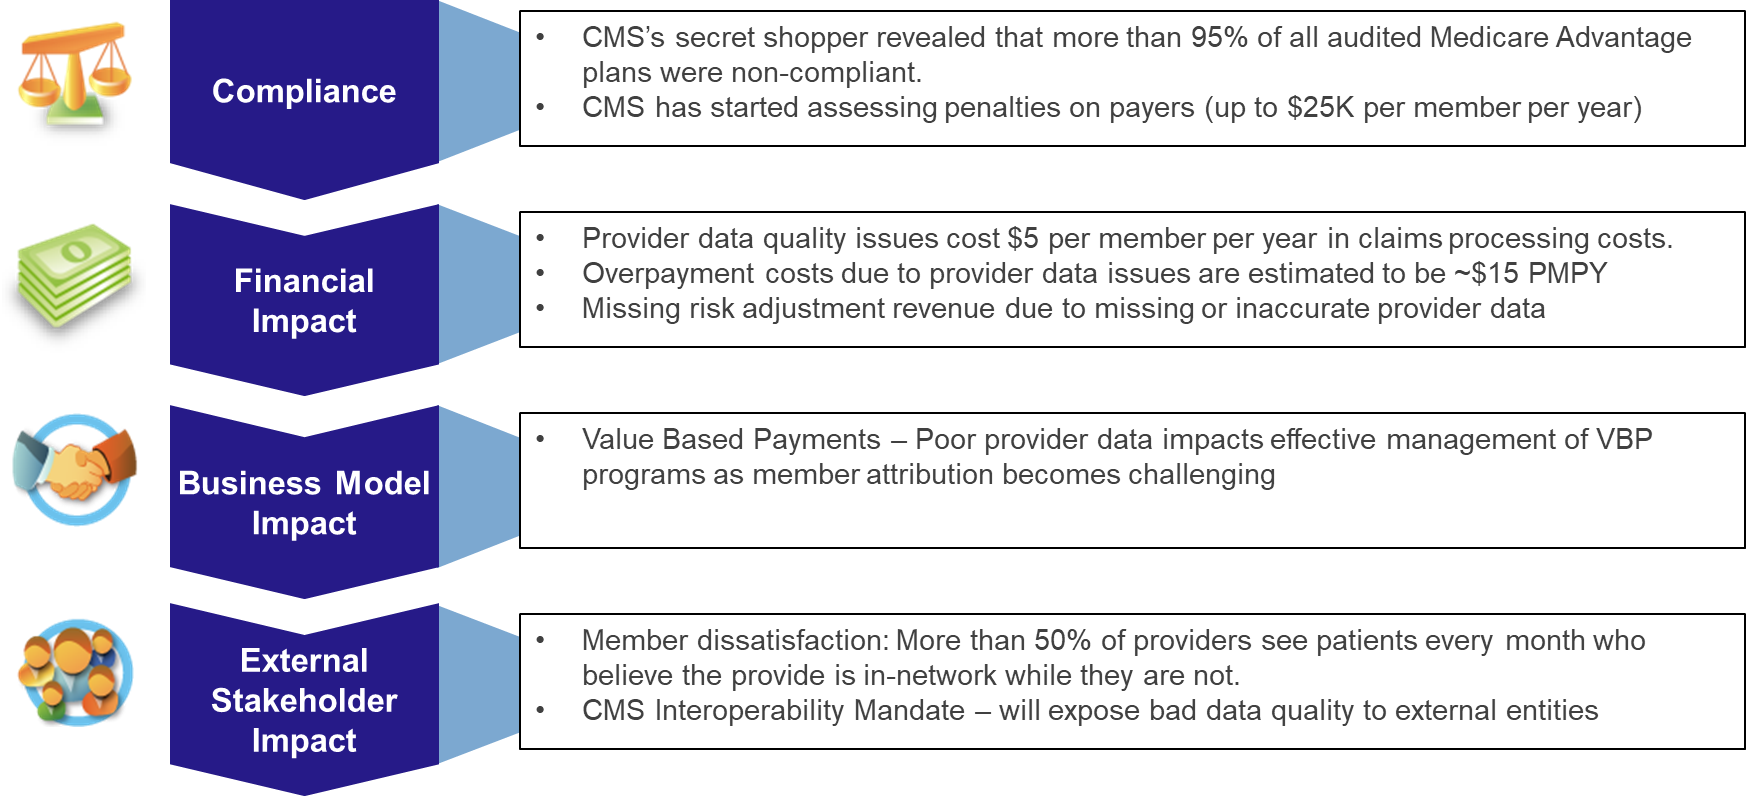
Bad provider data has significant costs to payers.

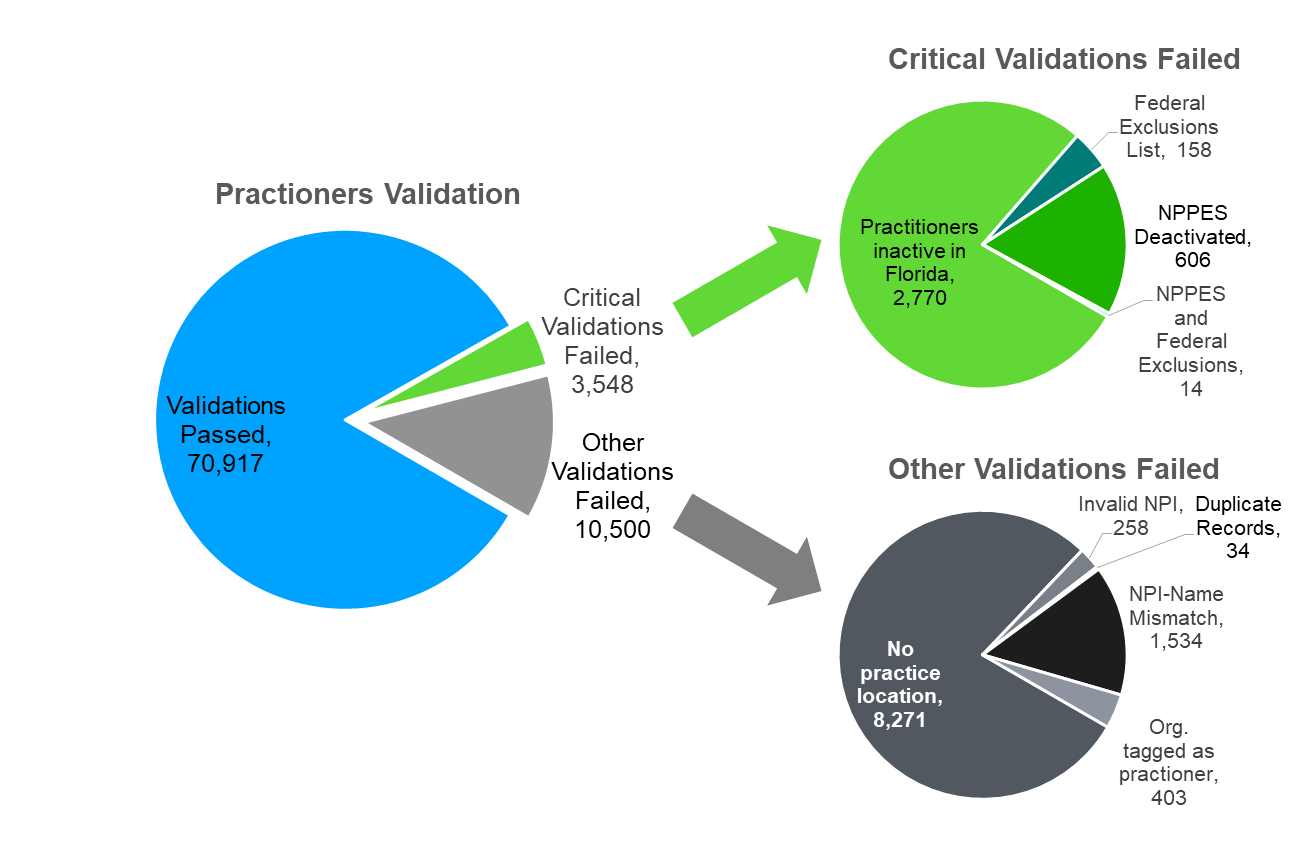
Health Sigma analyzed provider data for a regional FL payer with about 85,000 providers. Data quality assessment by Health Sigma identified that 4.2% of providers failed critical validations like inactive licenses, federal sanctions and NPPES issues. An additional 12.4% practitioners have other data integrity issues like invalid NPI, duplicate practitioners, NPI-Name mismatches and practitioners without a physical location.

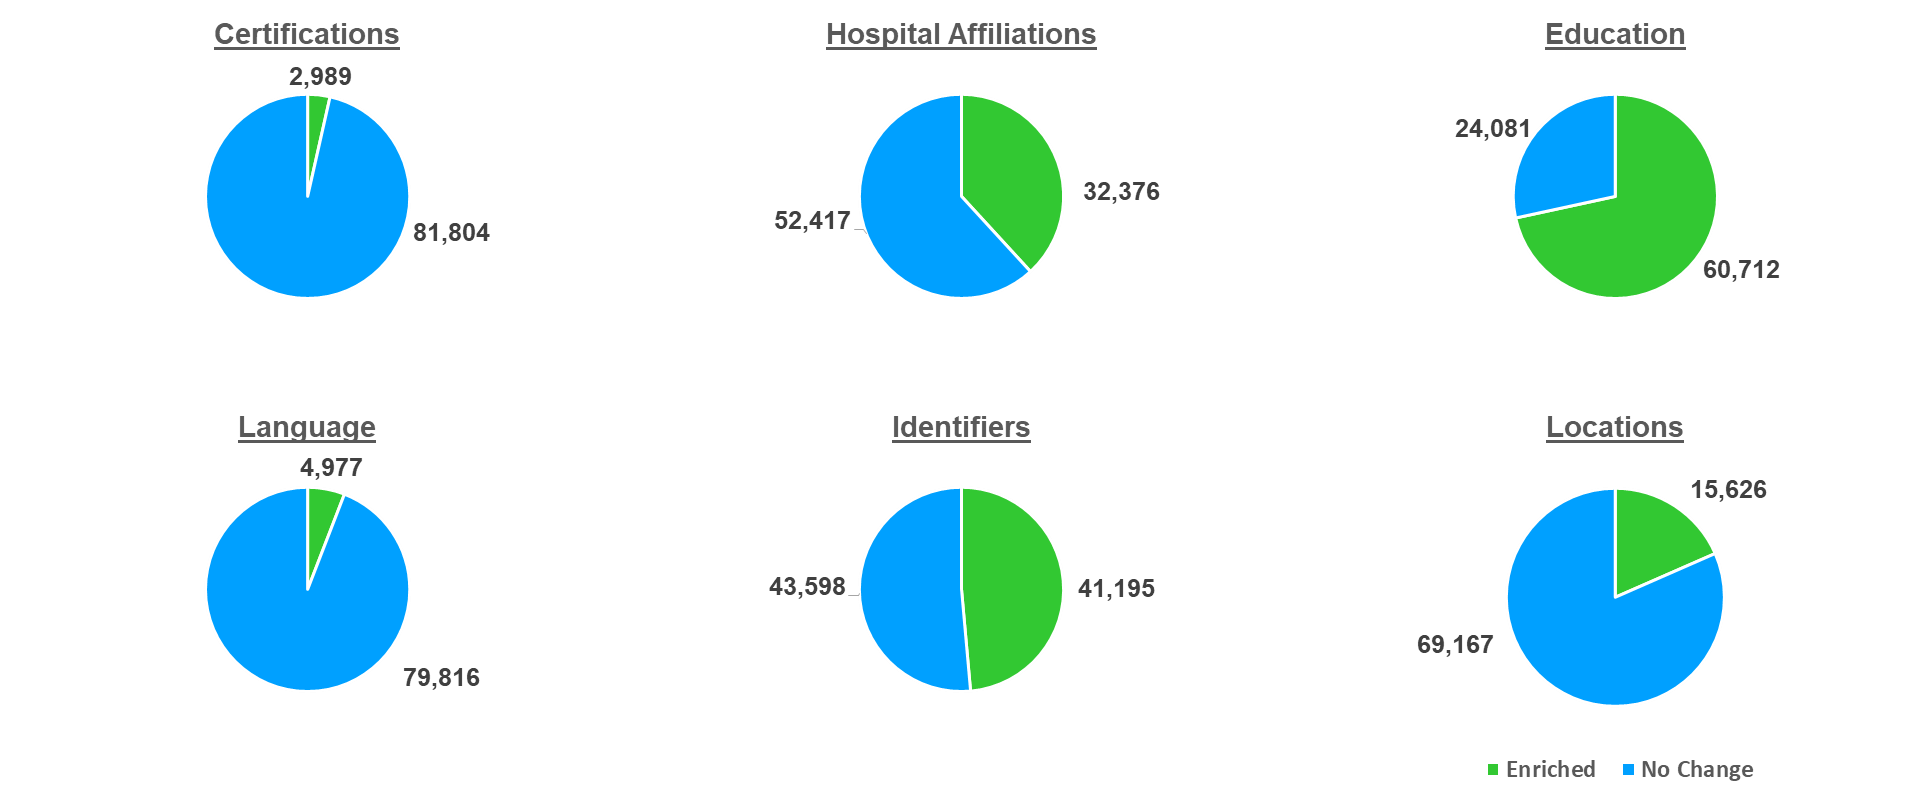
Apart from identifying issues in the provider data, Health Sigma enriched key information for providers leveraging automated data feeds from federal, state and other data sources

Read More

Medical Spend Analytics – Case Study

Medical Spend Analytics – Case Study

CFOs and CMOs get better insights into medical spending through HSI’s Medical Spend Analytics.

Payers, ACO, and self-insured employers don’t have a great insight into their medical spending – what accounts for year-over-year change. Without such insights, leadership cannot identify areas to target to manage costs and outcomes.

Health Sigma’s AI-driven Medical Spend Analytics to the rescue:

Health Sigma (HSI) has applied its Claims Analytics platform capabilities to this problem. HSI’s AI-driven claims analytics analyzes historical claims to parse out components impacting the spend and quantify their impact.

For a regional health plan, HSI conducted the analysis. The data below shows the payer’s reimbursement to one of its hospitals. While the year-over-year reimbursement to the provider reduced from $27.26M in 2018 to $25.53M in 2020, deeper dive analysis shows that most of the decrease in reimbursement is due to reduce claim volume. 

HSI Claims Analytics Results:

HSI further normalized the data by claim volume to quantify the impact of reimbursement rate increases and case-mix (member risk). 

Insights:

  • Member-risk reflected in case-mix has been increasing year-over-year. 2019 saw a 4.9% increase in the utilization of higher-cost services (normalized for rate increases and membership changes). The same metric for 2020 was 19.5% – unsustainably high. 
  • Provider rate increase impact: While the impact of provider rate increases was a reasonable 3% in 2019, it was 7.7% in 2020. The provider contracting team needed to do a better job of rate negotiation as the effective rate increase (across all services and accounting for utilization levels) was 7.7%. 

Read More

Utilization Analytics Case Study

Utilization Analytics Case Study

Utilization Analytics for Medical Management Leadership

Medical management leadership needs insights on utilization trends – normalized for rate increases, membership changes, and other variables. Understanding utilization trends can help UM teams better focus their energies on services with a spike in utilization. Medical management leadership lacks transparency into utilization numbers at the most granular level to make informed decisions and impact medical spending.

Health Sigma’s AI-driven Utilization Analytics to the rescue:

Health Sigma (HSI) has applied its Claims Analytics platform capabilities to this problem. HSI’s AI-driven claims analytics analyzes historical claims to identify trends normalized for rate changes, membership changes, and other variables that impact utilization.

HSI Claims Analytics Results:

For a payer, HSI’s analytics identified: 

  • 8% of reimbursement in 2020 were for services not reimbursed in previous years.
  • Generated a list of services reimbursed for the first time – for deeper dive review by the payer’s medical management team.
  • Flagged list of services with a significant jump in reimbursements – adjusted for rate increases and membership changes. For example, drug reimbursements and higher tier emergency admissions, normalized for reimbursement rates and membership, saw a steady increase in utilization.
  • Medical Management can refine UM policies based on the insights.

Read More

High-Need-High-Cost (HNHC) Analytics – Case Study

High-Need-High-Cost (HNHC) Analytics – Case Study

HSI helps payers identify high-need-high-cost population prospectively – with 80% accuracy

Healthcare consumption is uneven across the covered population. In fact, it is extremely skewed towards the top. The bottom 50% of consumers account for only 3% of healthcare spend while the top 1% accounts for 22% of the spending. 

For a payer, ACO, self-insured employer, or any risk bearer, identifying the high-utilizers prospectively (i.e. before the fact) is critically important. Not only can the risk-bearer manage financial risk better but also improve outcomes for this population. Even a small reduction in the utilization by this population, through proactive medical management, can have a meaningful impact on profitability. 

Traditional approaches to identifying the HNHC population are not very effective. Risk scores (typically used for identifying HNHC) are a poor predictor of future spending – only 20-25% of the utilization is explained by member risk scores. 

Health Sigma’s Artificial Intelligence to the rescue:

Health Sigma (HSI) has applied its Claims Analytics platform capabilities to this problem. HSI’s AI-driven prediction model uses historical claims, co-morbidities, risk scores, diagnosis codes, social determinants of health (SDOH) among others to drive the analysis

HSI Claims Analytics Results:

HSI’s AI-driven analytics identifies the target populations with better accuracy than other competing models. 

For a Medicaid plan, HSI identified 2.8% of the total population that will have high utilization, 27% of total spend to be precise. 

Prediction accuracy: Back-tested against historical data, 80% of predicted high-utilizers were in the top 10% of utilizers

Read More

A 299 bed, Chicago based hospital where we analyzed a pool of $26M of payer payments.

A 299 bed, Chicago based hospital where we analyzed a pool of $26M of payer payments.

About our customer

Our customer in this case study is a 299-licensed bed hospital with a mission is to provide compassionate medical and nursing care as well as advanced diagnostic and treatment services. The hospital provides the highest quality of healthcare to a densely populated community which includes industry leading spine and orthopedic practices, a radiology center, and an extensive outpatient services center. 

Getting started

To analyze underpayments, we first analyzed the payer mix and then focused on top payers – BCBS, Humana, United, Cigna, Aetna & Meridian. We zeroed in on $25.7M in payer payments for underpayment analysis.

Health Sigma then analyzed a pool of $26M of payer payments. Less than 1% of claims had underpayments. However, those underpaid claims accounted for $291K in underpayments. 

Underpayments Analysis

What we found:

  • Accuracy of payments varied significantly
  • UHC, BCBS and Meridian had low underpayment rate (~0.2%)
  • Humana had 1% underpayment primarily due to erroneous DRG downgrades
  • Cigna had most egregious rate – primary root cause was due to continuing to apply special discount clause that termed 5 years ago

In addition to incremental revenues, Health Sigma’s analysis identified

  • Coding best practices that would generate incremental revenues
  • Contract issues including:
    • Products that did not have rate increases for last 5 years
    • Rate comparisons across payers – so the hospital could renegotiate with payers paying significantly lower than other payers
  • Process to track DRG downgrades – so they can be appealed, and correct payment realized
  • Understanding and interpretation of Experience Files from BCBS – a unique payment process Blues apply in certain markets

Read More